Back To Basics: Simple debugging tips in Xcode
As developers we spend most of our lives dealing with broken and barely-functional software: our own software. We do our best to make the applications we develop somewhat less broken and try to add features to make it functional. And once we finally get our software working bug-free and functioning stably, what do we do? Do we bask in the joy of a stable app and spend countless hours enjoying that moment? No, we move on to v1.1 or v2.0, adding more features and consequently more bugs. It’s kind of sad if you think about it.
Since much of our lives are spent with applications in various states of brokenness, understanding how to debug our software and catch those exceptions that arise is vital to getting our applications to a stable state so we can release, consequently moving on to create a whole new set of bugs that need to be fixed.
Here are some basic tips and tricks to make your life easier dealing with Xcode 4, and tracking down those places where your code runs off into the bushes.
Using breakpoints

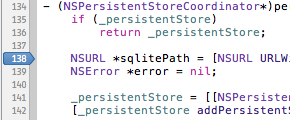
Most people are familiar with the concept of breakpoints, but if you’re not I’ll reproduce it here. Click the line number next to a line of code, and a breakpoint icon will show up, causing your application to pause when it gets there. From that point you can inspect the values of variables within your scope, you can single-step from one line of code to the next, etc. It’s something most web developers wish they had.
Editing breakpoints

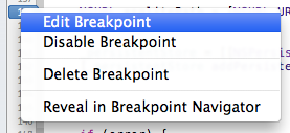
You can also edit breakpoints. Right-click on a particular breakpoint and you can click the “Edit Breakpoint” menu. You also have a few other options available to you, including the ability to disable or delete a breakpoint. However there’s easier ways to do the same things; you can either drag the breakpoint off of the line-number margin, just like removing an icon from your dock, or you can click the line to toggle its “disabled” state.
Conditional breakpoints

When you select “Edit Breakpoint” you are presented with a context menu showing additional options for that breakpoint. You can set a condition that will cause your breakpoint to trigger only when that condition is met, you can cause it to ignore the breakpoint until a certain number of times, and can even trigger complex actions to be performed automatically when that breakpoint is hit.
For example, you can log a line to the console, you can play a sound, you can capture an OpenGL frame for later comparison, and can even invoke a shell script or AppleScript.
Managing your breakpoints

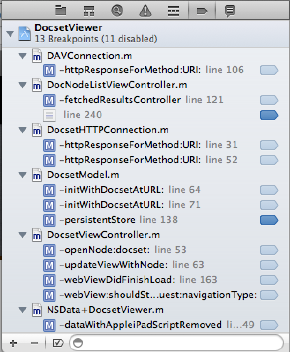
Once you have a lot of breakpoints in your code it can often be difficult to manage it. So in the Xcode 4 navigator pane you can click on the “Breakpoints” tab (or you can press ⌘-6) to see a full list of your current breakpoints.
You can enable or disable the breakpoints right from there, you can delete them, etc. But as you can see, at the bottom of the navigator, there’s a toolbar. From there you can create new breakpoints, filter breakpoints, and other fun tasks.
The most important feature here however is the ability to add explicit breakpoints without having to have an associated line number. Clicking the “+” button brings up a menu with two options: “Add Exception Breakpoint” and “Add Symbolic Breakpoint”.
Exception breakpoint
This is perhaps one of the most powerful breakpoints you can have in your debugging arsenal, and is something you’ll almost always want to add to your project. In a nutshell it will cause your program to pause at a line that triggers an exception, rather than simply crashing and burning with an EXC_BAD_ACCESS or some other similar exception.
This makes debugging your code quite a lot easier because instead of seeing a mysterious crash in main.m, or in objc_msgSend, you will see the line of code in your application that resulted in that exception happening in the first place. This is true debugging power because without that bit of context you’d have no other idea about where or why your application is crashing.
Symbolic breakpoints
Symbolic breakpoints are just like regular breakpoints, but instead of catching a particular line of code, you can pause your application when a method or function call is made. There are some pre-defined symbols you can use, or you can break on a particular method name. For example, “objc_exception_throw” is a handy symbol to break on since it will capture an exception being thrown, regardless of whether or not it is caught. Another useful breakpoint to set is “-[NSObject doesNotRecognizeSelector:]” which will allow you to capture situations where a selector is being invoked against the wrong object.
There are of course other symbolic breakpoints you can set but there’s too exhaustive of a list to outline them here, so use the Almighty Google for future reference.
Using the debugger console
Once your breakpoint has triggered, your next question may be “Well now what?” What can you do with your code once your program has suspended? The most obvious thing you can do is single-step through the following lines to see what happens, what paths your code takes, and so forth. But there will be times that you’ll want to deeply inspect properties or ivars in ways that the variable window won’t let you. For this you can use the debugger console to control the debugger explicitly to find answers to your question “What’s my app doing right now?”
Printing objects
Say for the sake of argument that you’ve got an ivar named “_myDictionary” that contains some object, and you want to print out its default value. That’s simple, you can click in the console window (the right-hand pane of the bottom debugger panel), and you can type: “po _myDictionary“. That will print out the result of the -[NSObject description] method for that object.
However lets say you want to dig deeper, and want to print the result of a method call on that dictionary. This is also simple: “po [_myDictionary allKeys]” works just as well. The debugger console doesn’t understand Objective-C 2.0 Properties, but regular bracket-notation method calls works.
Printing primitives and structs
What if what you want to print isn’t an object? What if you want to print out the value of a literal (e.g. a float or NSUInteger), a struct (e.g. CGRect, CGPoint, etc), or really anything else that may or may not be an object? With that you can use the “p” command. However since you’re not printing an object, you need to give the debugger a hint about what kind of primitive you’re expecting.
To print a float, I would say: “p (float)_myFloatValue“. Simple variable casting here works just great.
Printing out the frame of a view is also pretty simple. “p (CGRect)[[self view] frame]“. You notice here that I’m combining a set of method calls with a casted print statement. This will give you a pretty-formatted rendition of the rect, making it easier to debug.
Printing CPU registers
When your code is compiled down into machine code and is run on a device, your CPU steps through each operation and invokes them sequentially. When something goes wrong, and your program suspends, there are ways to inspect the state the CPU was in when a crash occurred and you can glean information from it. This is a lot less difficult than you might think. For more information on this topic, please refer to this excellent post titled So you crashed in objc_msgSend(). I’ll only be giving a high-level overview, so I highly suggest you read and bookmark that link.
Consider the sample that that above post tries to cover: your application has crashed in the objc_msgSend() method, which is Objective-C’s low-level method invocation function. When this happens you usually don’t have any information to go on, other than a cryptic exception titled EXC_BAD_ACCESS, with your breakpoint pointing at your main.m file.
By printing the value of the CPU registers in the debugger console you can extract information about what method was being invoked. Typing “x/s $ecx” for the iOS Simulator, or “x/s $r1” for an iOS device, will print the name of the selector that was being run that resulted in a crash. It’s that simple!
Perhaps even more useful is when you encounter situations where you crash at objc_exception_send but it doesn’t give you the reason for the exception. Simply drop into GDB and type “po $eax” for the simulator, or “po $r0” for the device, to print out the message of the exception.
Defensive coding
Above all else some of your best debugging techniques will be to avoid crashes altogether. Practice defensive coding by using some common C and Objective-C patterns. Don’t retain delegates, release your ivars in dealloc or in viewDidUnload. And when you release an ivar, also set its value to nil. In fact I go so far as to create a macro that handles that for me.
#define DNRelease(x) [x release], x = nilA technique referred to as “Yoda-Conditions” means for you to reverse your conditionals so that constants are placed on the left-hand side of your operator. For example:
if (YES == someBoolean) ...That is much less intuitive since nobody but Yoda speaks in reverse like that, but what this does buy you is compile-time protection against accidentally assigning a value instead of comparing it. A simple “if (someBoolean = YES)” statement can be time-consuming to track down and is easily avoided if you always write your comparisons the other way around.
And above all else make sure you write readable code. Nobody likes ugly code, but for more than pure aesthetics. Ugly or confusing code can hide more bugs, and when you use good whitespace, sensible variable names, and you structure your code cleanly, you can expose bugs earlier and make them easier to track down later.
Good luck and happy bug-hunting, and I hope this starts you off on the right foot!